Benchmarks and results
- Appraisal Toolkit Administrator
When your feedback cycle is complete you will be able to view your feedback report. The reports displays your feedback results in an easily understood format, and can also be viewed in your Portfolio and added to your appraisal.
To see how to import complete feedback obtained through Clarity Appraisals into your appraisal, click here.
To see how to manually add MSF cycles completed outside of Clarity Appraisals into your appraisal, click here.
Want to see how we calculate our benchmarks? Click here.
What is the benchmarking for?
Although reviewing the results of MSF questionnaires can provide valuable insight into how your colleagues and patients perceive your professional performance, benchmarking provides perspective for your results. Due to the nature of multi-source feedback, often the results received can be highly skewed, therefore you cannot fully interpret your results without taking into consideration the scores of your peers.
Clarity’s Benchmarking tool allows you to compare your results with the minimum and maximum scores received by clinicians using Clarity questionnaires, the upper and lower quartiles and the average (both the mean and the median) scores for each question. By comparing your scores with the scores received by your peers nationally, within your organisation or within your specialty, you can reflect upon your performance more effectively and discuss any areas you are excelling in or that require improvement with your appraiser.
As a personal auditing tool, we also provide the standard deviations for the scores of each question and provide an “alert line” on the graph to highlight outlier scores. Outliers are calculated as 2 standard deviations (or below) the mean score. You should use your appraisal as an opportunity to discuss scores that fall below this threshold in particular with your appraiser, and create PDPs to focus on improving your skills in these areas.
You should also take the opportunity to discuss any areas you are performing particularly well in with your Appraiser, focussing on how to maintain and further develop your performance.
Need more information?
Read the Benchmarking FAQs here.
Calculation guide
Clarity’s MSF benchmarks are calculated using simple statistical calculations. The example below shows how written descriptions (poor, satisfactory, etc.) are assigned numerical values and how the various scores shown on your results sheet are calculated.
Averages
Example:
You complete your MSF cycle with 23 responses. The responses you receive for the first question are as follows:
- Poor: 1
- Less than satisfactory: 3
- Satisfactory: 2
- Good: 5
- Very good: 7
- Don’t know: 2
- Not answered: 2
- Spoilt: 1
To allow us to perform the necessary calculations, each answer is scored as a percentage:
| Poor | Less than satisfactory | Satisfactory | Good | Very good | Don't know | Not answered | Spoilt (damaged/unreadable/other) |
|---|---|---|---|---|---|---|---|
| 0 | 25 | 50 | 75 | 100 | 0 | 0 | 0 |
To calculate the average overall score for this question the system performs the following calculation:
(0 x 1) + (25 x 3) + (50 x 2) + (75 x 5) + (100 x 7)
18
Your score for Question 1 = 69.44
- The denominator is 18 rather than 23 due to the 5 non-answered, spoilt or “don’t know” responses. "Poor" responses are still included in the denominator.
Please note: The average score per question per cycle is used when collating the data for national/organisational/specialty benchmarks.
Quartiles
The system also uses the numerical conversions above to calculate the Lower Quartile, Median, Upper Quartile and standard deviation of your results.
Example:
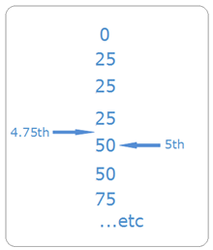
Your lower quartile is calculated as the 4.75th number on your list:
(18+1)/4 = 4.75
- Again, 18 is used rather than 23 as the 5 non-answered/spoilt responses are not included.
Please note: As the calculations are written in programming code, the results obtained for quartiles (including the median) may differ from those calculated manually or in Excel. The code is programmed to use interpolation when finding quartiles to provide the most accurate results.
- Excel: Rounds the number 4.75 to 5 and returns the lower quartile as the 5th number on your list.
- Appraisal Toolkit: Uses interpolation to calculate what number would exist at the 4.75th position on the list, giving the exact number that 25% of values from the list are smaller than.
Statistically, the lower quartile can be calculated using either method, however we use interpolation to give the most accurate results possible.
Alert Scores
The alert score on the graph is calculated as two standard deviations from the benchmark mean (whether national/organisational/specialty).
Example:
The benchmark mean = 84.17
The standard deviation for the results = 12.58
The alert score for this question:
84.17 - (12.58 x 2) = 59.01